Recent
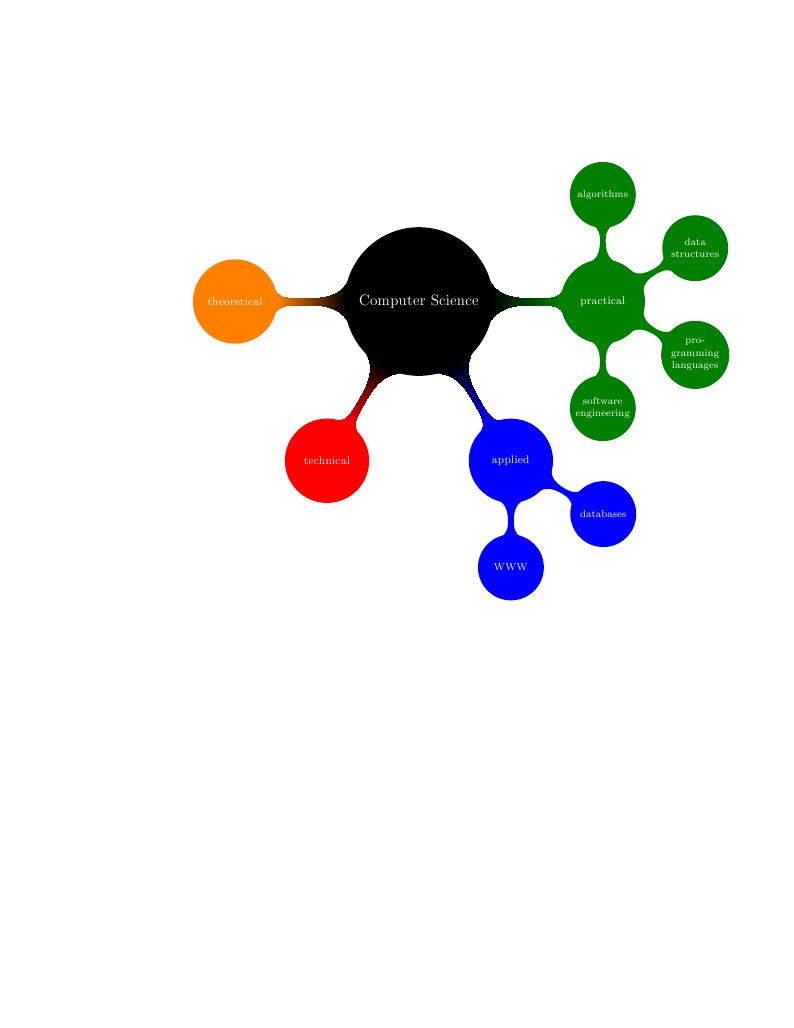
LaTeX isn't just for reports and papers - the powerful TikZ package can be used to create professional graphics and diagrams with only a few lines of text Here's the perfect example from TeXample.net that's pre-loaded in writeLaTeX for you to try out - just click to open & edit online instantly. For comments and discussions on this example, see the TeXample page. New to LaTeX and want to find out more? Our Interactive Introduction to LaTeX course is freely available online, and Part 3 gives some great tips for creating your own presentations and drawings. Check it out today!
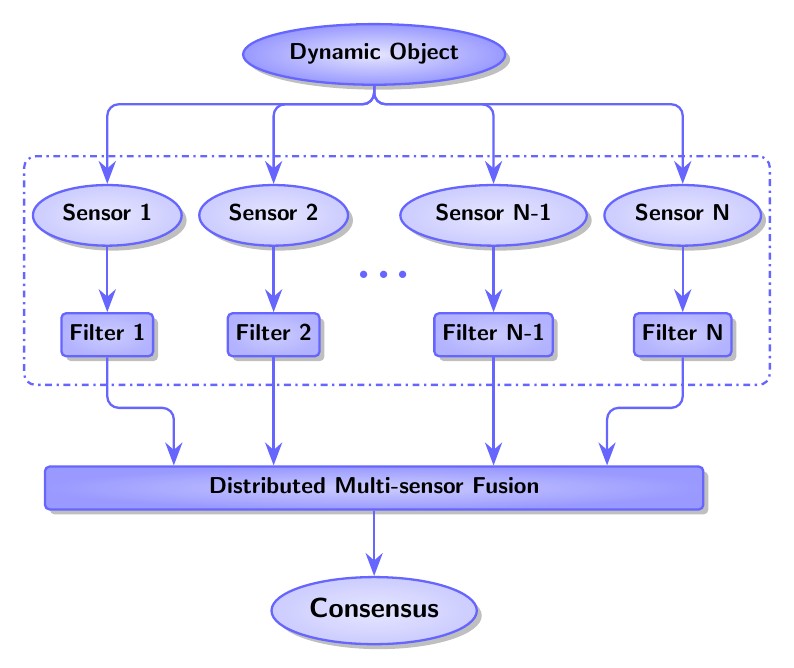
The output of this graph is used as Figure 1 of the paper: Wangyan Li, Zidong Wang, Guoliang Wei, Lifeng Ma, Jun Hu, and Derui Ding, “A Survey on Multisensor Fusion and Consensus Filtering for Sensor Networks,” Discrete Dynamics in Nature and Society, vol. 2015, Article ID 683701, 12 pages, 2015. doi:10.1155/2015/683701. It's based on http://www.texample.net/tikz/examples/hierarchical-diagram/. Relevant link: http://tex.stackexchange.com/questions/226461/how-to-draw-hierarchical-graph-like-this-one.

Flag of the Republic of Korea, according to official government specifications

Flag of the Democratic People's Republic of Korea
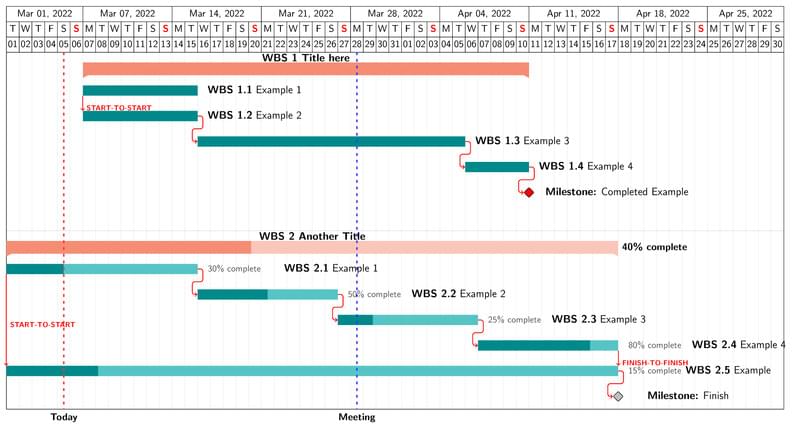
A Gantt chart template with already set up progress tracking and automatic calculation.
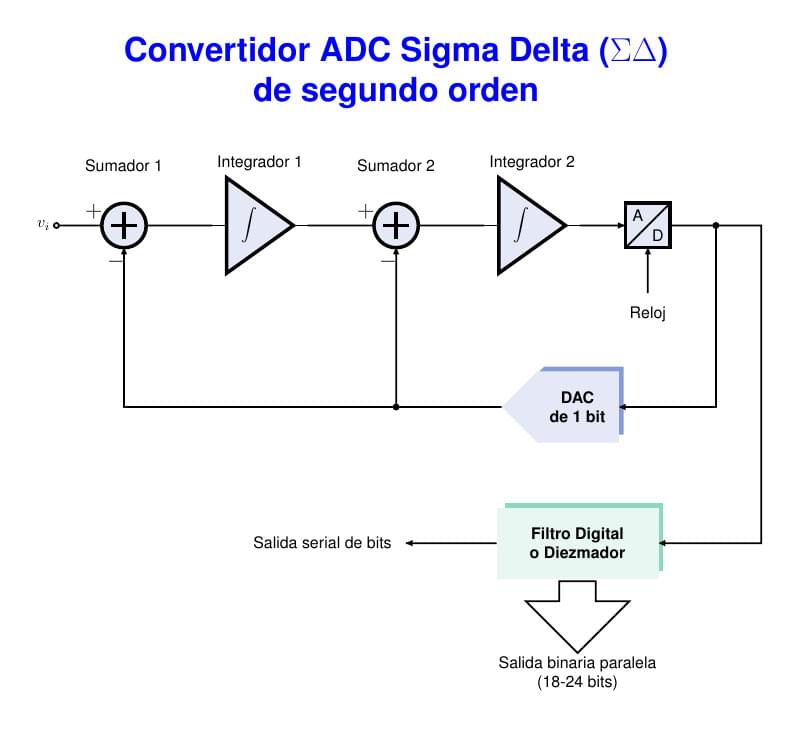
Este ejemplo muestra el Convertidor ADC (Analógico a Digital) Sigma Delte de Segundo Orden que a diferencia del Convertidor de primer orden, tiene dos etapas integradoras de las señales de diferencia que provienen de los sumadores. En este caso, a la salida del segundo integrador aparece el comparador como convertidor ADC de 1 bit cuya salida alimenta al bloque convertidor DAC (Digital a Analógico) de 1 bit y a la etapa de Filtro Digital o Diezmador. La teoría, en idioma inglés, de este diseño se encuentra en el documento "How delta-sigma ADCs work, Part 1", publicado por la empresa Texas Instruments de Bonnie Baker, disponible en el enlace https://www.ti.com/lit/pdf/slyt423?keyMatch=BONNIE%20BAKER&tisearch=Search-EN-technicaldocument
tikzposter is highly customizable: please see the style guide. Some nice themes are available.
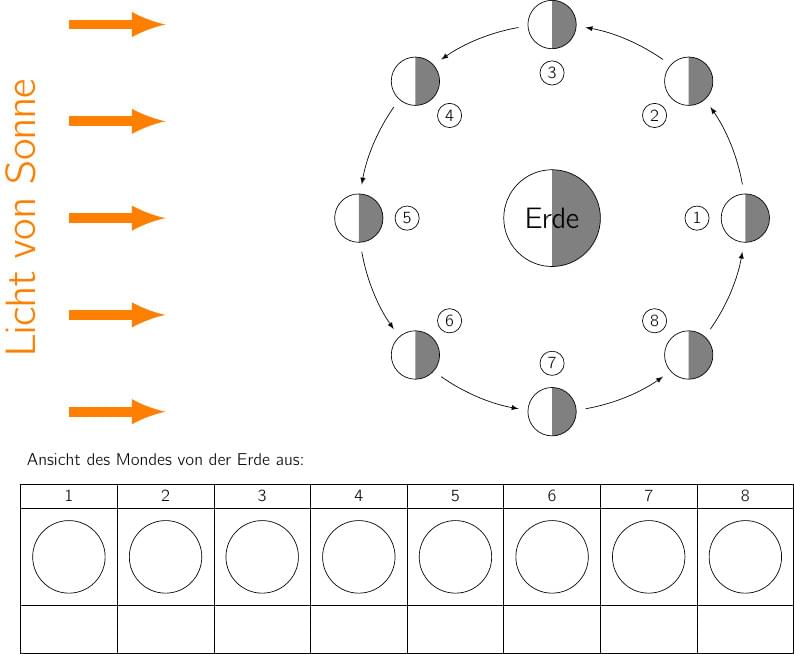
moon phases, light, physics, optics, sun, earth, half moon
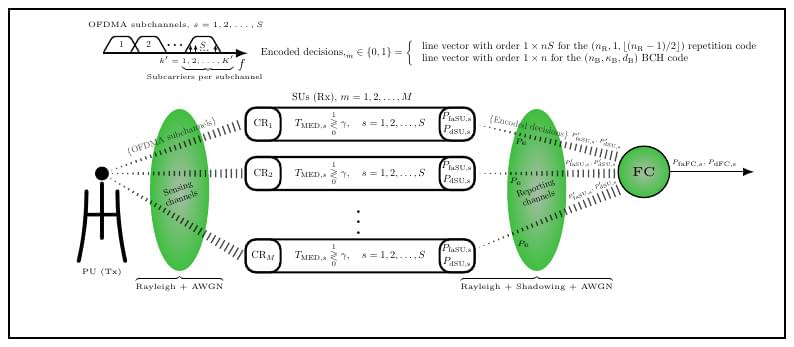
Centralized decision fusion CSS of OFDMA subchannels
\begin
Discover why over 25 million people worldwide trust Overleaf with their work.